Cancer Statistics Online Dashboard

​​The BC Cancer Statistics Online Dashboard provides user-friendly and interactive visualizations to explore the current landscape of cancer in British Columbia.

​​​​​​​​​The BC Cancer Statistics Online Dashboard enables users to estimate disease burden, monitor trends over time, project future cancer incidence, analyze treatment utilization, and compare patterns across cancer types, demographic groups, and geographic areas. The dashboard was developed by ​Data and Analytics, BC Cancer, Provincial Health Services Authority (PHSA), to enhance access to timely and comprehensive cancer statistics in the province. For details on data updates and recent enhancements, please refer to the Release Notes​.

Refer to the General User Guide for help navigating and using the dashboard. Some additional reports can be found under the Other Reports. Please cite any data used from the BC Cancer Statistics Online Dashboard; see the Acknowl​​​edgements & Citation page for details. 

​The following cancer statistics are available:​​

BC Summary Statistics Dashboard​

BC Summary Statistics Dashboard​ provides an overview of cancer statistics in British Columbia and health authorities based on the most recent estimates available. It presents key indicators such as the lifetime risk of being diagnosed with or dying from cancer, the most commonly diagnosed cancers and leading causes of ​cancer deaths, annual and projected numbers of new cancer cases, survival rates, and the number of cancer deaths potentially avoided. ​


​Incidence​​

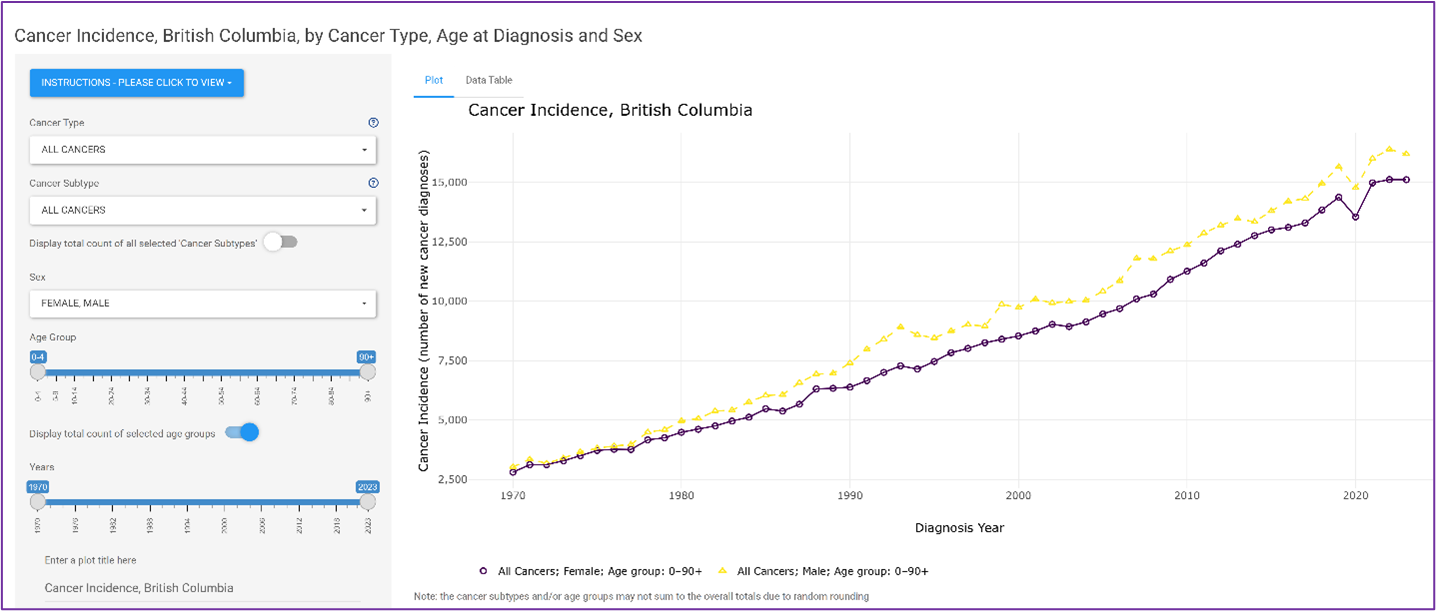
Cancer Incidence Counts in BC Dashboard provides an overview of annual trends in newly diagnosed cancer cases across British Columbia since 1970. Users can explore data by cancer type, cancer subtype, age group, sex, and year range. The dashboard also offers customizable data tables and options to download results for further analysis (Cancer Incidence, British Columbia, by Cancer Type, Age at Diagnosis and Sex).​​


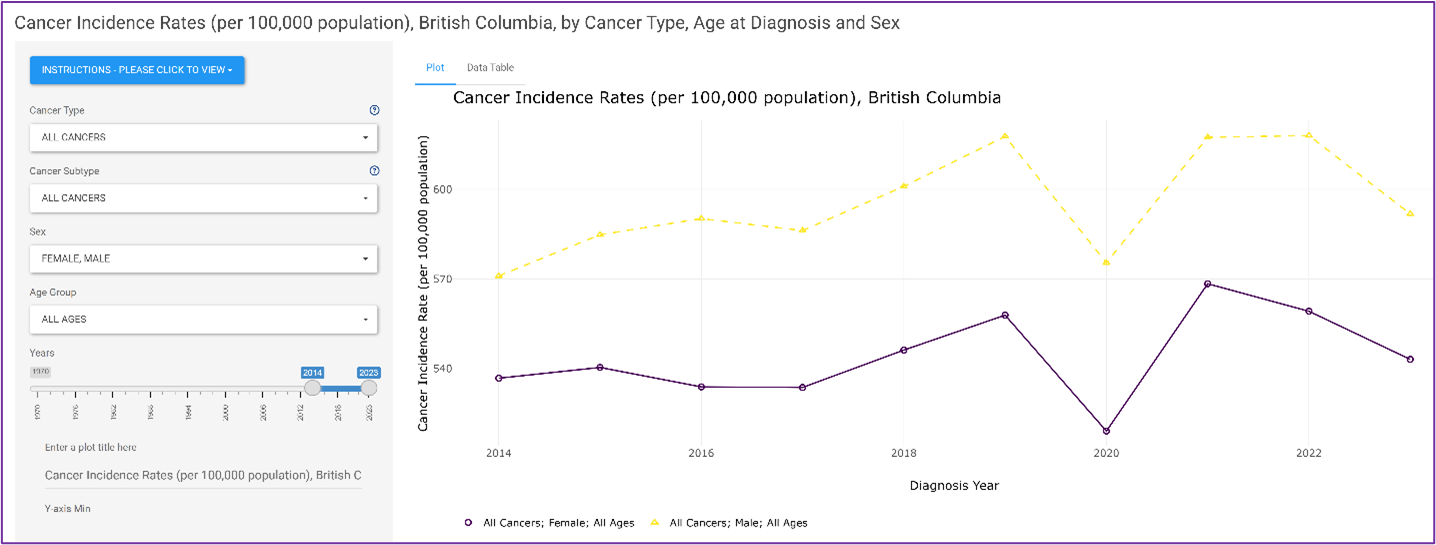
Crude Cancer Incidence Rates in BC Dashboard presents annual patterns of crude cancer incidence rates (per 100,000 population) across British Columbia beginning in 1970. The dashboard allows users to filter results by cancer type, cancer subtype, age group, sex, and year range. Data can also be viewed in interactive tables and exported for further use or analysis (Cancer Incidence Rates (per 100,000 population), British Columbia, by Cancer Type, Age at Diagnosis and Sex).

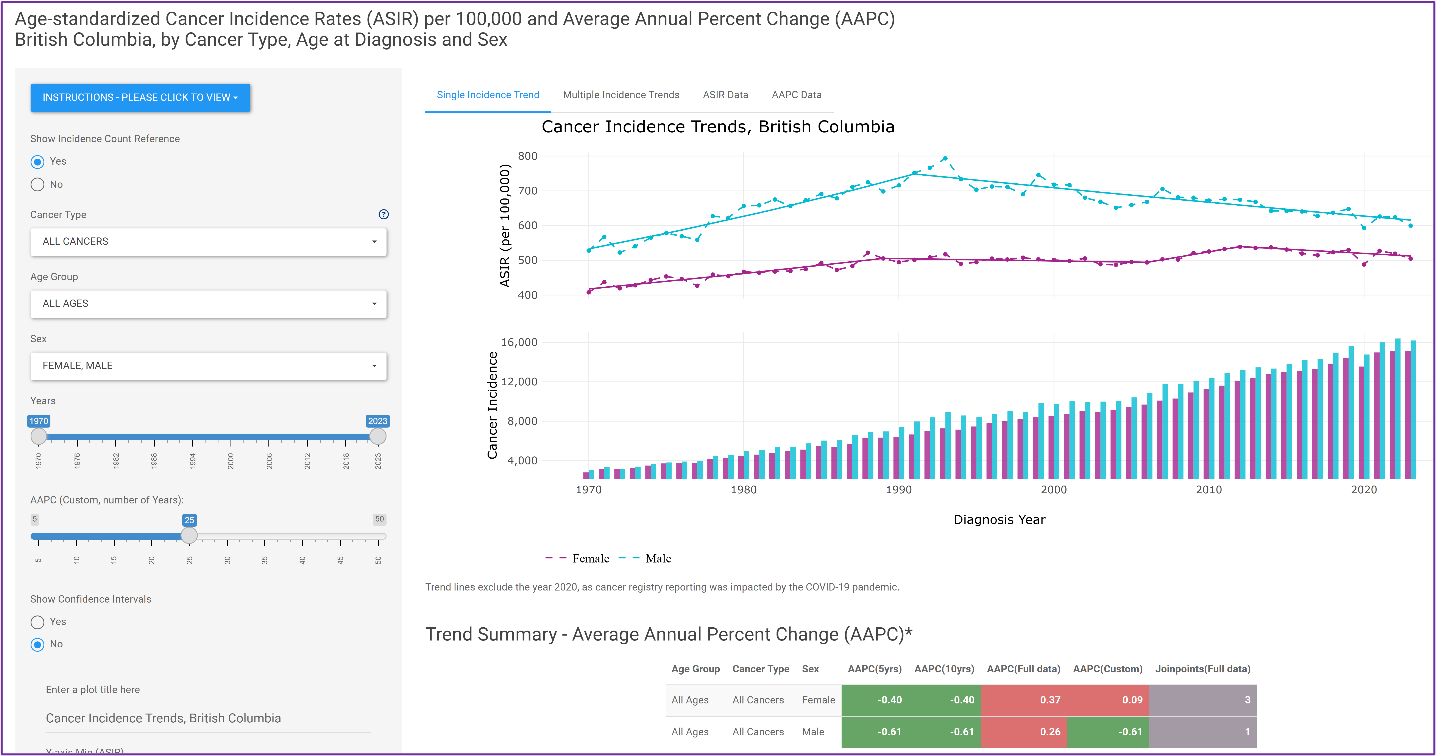
​​Age-Standardized Cancer Incidence Rates in BC Dashboard provides an overview of annual trends in age-standardized cancer incidence rates (ASIR, per 100,000 population) across British Columbia since 1970. It also displays the average annual percent change (AAPC) in these rates over time. This interactive dashboard allows users to customize their selections by cancer type, age group, sex, and year range. Results can be viewed in customizable data tables and downloaded for further analysis (Age-standardized Cancer Incidence Rates (ASIR) per 100,000 and Average Annual Percent Change (AAPC), British Columbia, by Cancer Type, Age at Diagnosis and Sex).

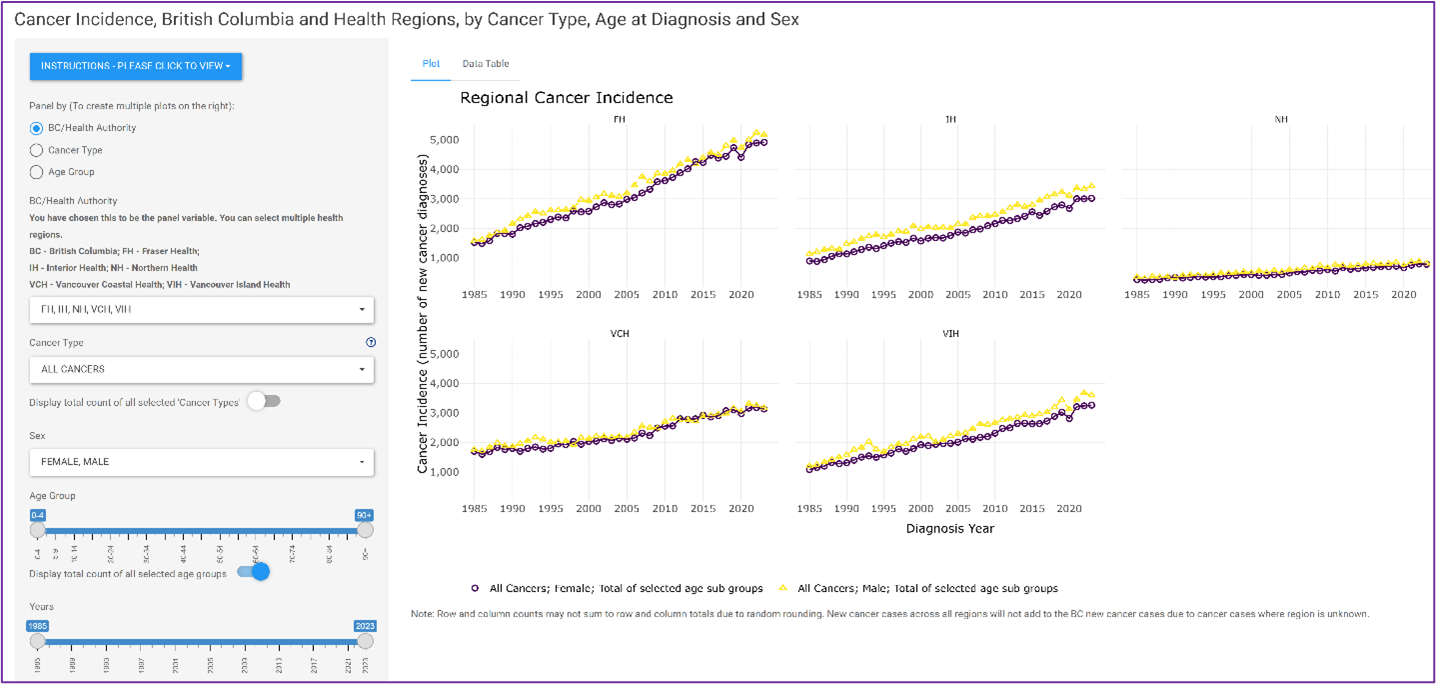
Cancer Incidence Counts in BC Health Regions Dashboard presents annual trends in newly diagnosed cancer cases across British Columbia’s five health authorities: Fraser Health (FH), Interior Health (IH), Northern Health (NH), Vancouver Coastal Health (VCH), and Vancouver Island Health (VIH), beginning in 1985. This interactive dashboard allows users to filter data by cancer type, age group, sex, and year range. Results can be viewed in customizable data tables and downloaded for further analysis (Cancer Incidence, British Columbia and Health Regions, by Cancer Type, Age at Diagnosis and Sex). ​


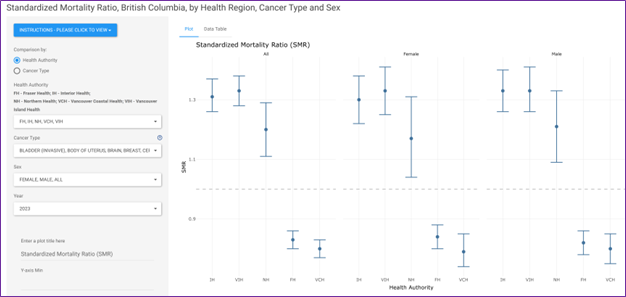
Standardized Cancer Incidence Ratio in BC Health Regions Dashboard provides an overview of Standardized Incidence Ratios (SIR) and their 95% confidence intervals across British Columbia’s five health authorities — Fraser Health (FH), Interior Health (IH), Northern Health (NH), Vancouver Coastal Health (VCH), and Vancouver Island Health (VIH) — beginning in 1985. The SIR compares the observed number of cancer cases in each region to the number expected based on provincial rates, allowing users to identify areas with higher or lower cancer incidence relative to the BC average (SIR = 1). This interactive dashboard enables users to explore data by health authority, cancer type, sex, and year range. Results can be viewed as data tables and are downloadable for further analysis (Standardized Incidence Ratio, British Columbia, by Health Region, Cancer Type and Sex).


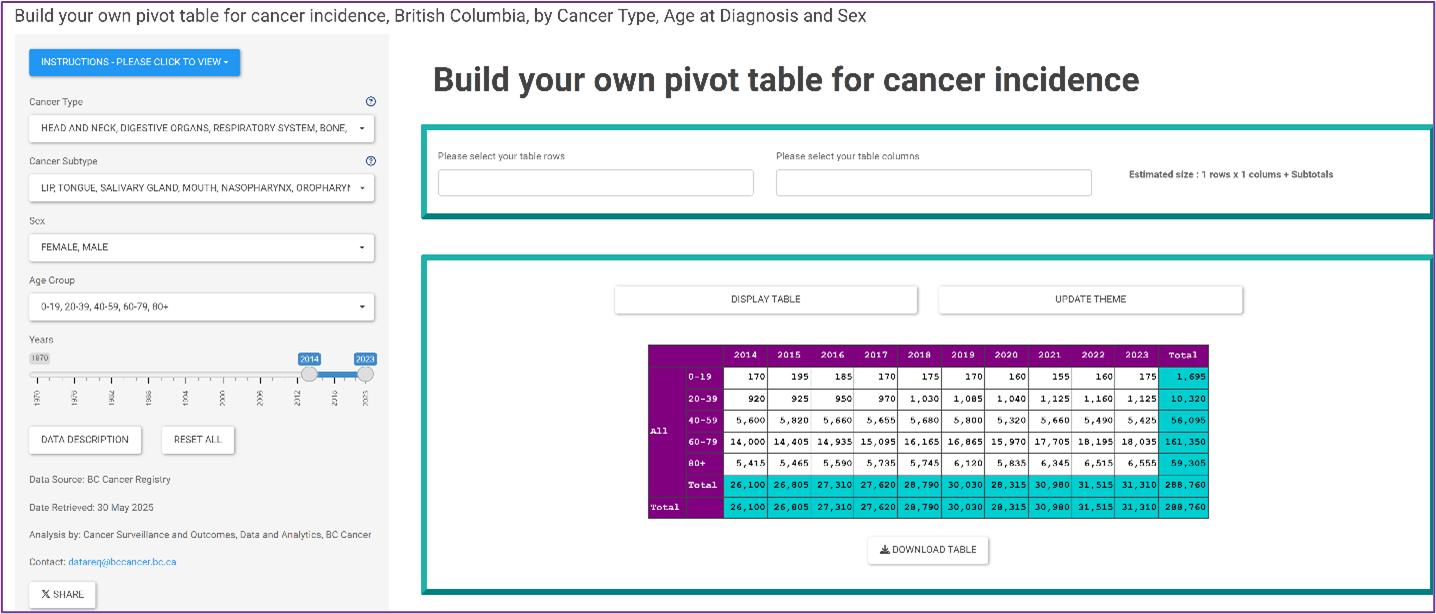
Create Your Own Pivot Table of Cancer Incidence Counts in BC Dashboard allows users to create custom tables of incidence cancer cases in British Columbia since 1970. It provides a flexible, user-driven interface where you can select variables of interest including cancer type, cancer subtype, sex, age and year range, and then build a tabular output tailored to your needs. The output table is downloadable so you can export it for further analysis (Build your own pivot table for cancer incidence, British Columbia, by Cancer Type, Age at Diagnosis and Sex). 


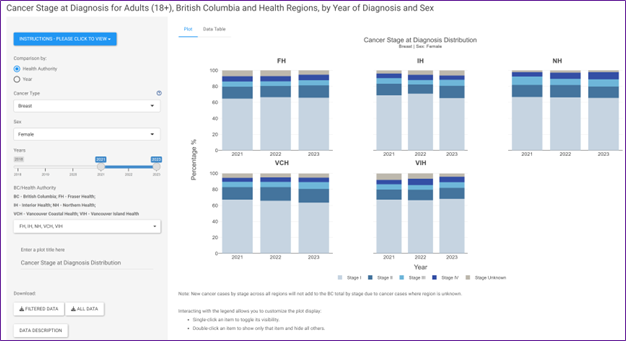
Cancer Stage at Diagnosis in BC Health Regions Dashboard presents annual trends in the distribution of cancer stages at diagnosis for common cancer types across British Columbia’s five health authorities — Fraser Health (FH), Interior Health (IH), Northern Health (NH), Vancouver Coastal Health (VCH), and Vancouver Island Health (VIH) — beginning in 2018. This interactive dashboard enables users to filter data by health authority, cancer type, sex, and year range. Results can be explored through panel bar charts and customizable data tables, which can also be downloaded for further analysis (Cancer Stage at Diagnosis for Adults (18+), British Columbia and Health Regions, by Year of Diagnosis and Sex). 


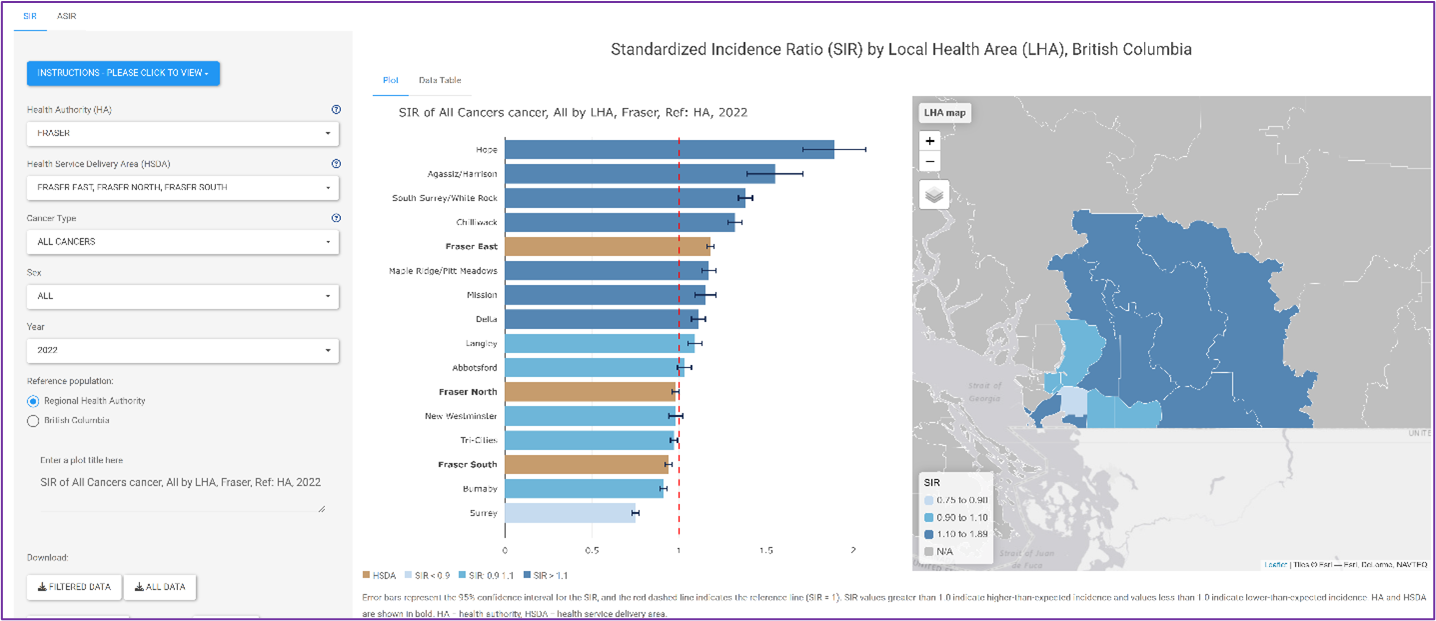
Cancer Incidence in Health Services Delivery Areas and Local Health Areas in BC Dashboard allows users to explore and compare cancer incidence across different geographic levels — including health authorities, health service delivery areas (HSDA), and local health areas (LHA). The dashboard presents both standardized incidence ratios (SIR) and age-standardized incidence rates (ASIR) to show differences in cancer burden across regions and over time. SIRs and ASIRs are calculated using 5-year rolling averages to improve stability and enable meaningful comparison across regions and years. An interactive heat map highlights areas with higher or lower cancer incidence, while trend charts display how rates have changed over time. Users can also view and download customizable data tables for further analysis (Standardized Incidence Ratio (SIR) by Local Health Area (LHA), British Columbia; Age-Standardized Incidence Rate (ASIR) per 100,000 by Local Health Area (LHA), British Columbia). 

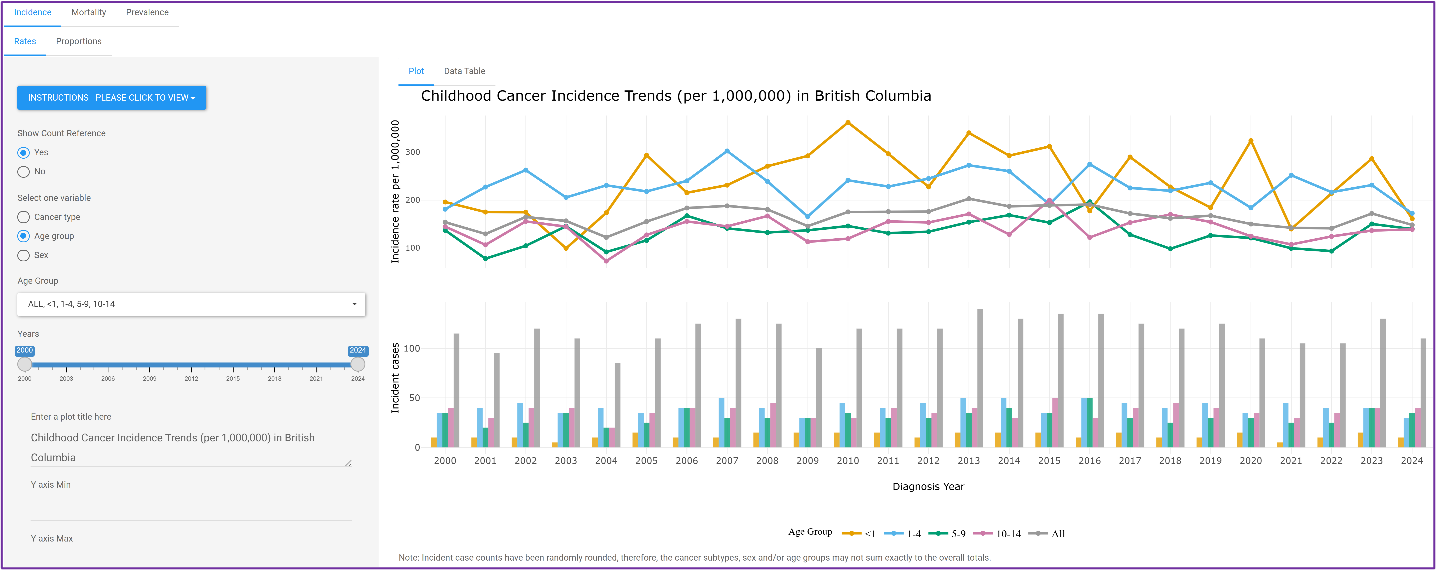
Childhood Cancer Incidence in BC Dashboard​ provides an overview of annual trends in crude and age-adjusted incidence rates, as well as the number of new childhood cancer cases in British Columbia since 2000. Results can be explored by cancer type, age group, sex, and year range, and the dashboard also presents the proportional distribution of childhood cancers. Customizable data tables are available, with options to download results for further analysis. 

Mortality

Cancer Mortality (Deaths) in BC Dashboard​ provides an overview of annual trends in the number cancer deaths across British Columbia since 1995. Users can explore data by cancer type, cancer subtype, age group, sex, and year range. The dashboard also offers customizable data tables and options to download results for further analysis (Cancer Mortality, British Columbia, by Cancer Type, Age at Death and Sex).


Crude Cancer Death Rates in BC Dashboard presents annual patterns of crude cancer mortality rates (per 100,000 population) across British Columbia beginning in 1995. The dashboard allows users to filter results by cancer type, cancer subtype, age group, sex, and year range. Results can be viewed in dynamic tables and downloaded for further analysis or reporting (Cancer Mortality Rates (per 100,000 population), British Columbia, by Cancer Type, Age at Death and Sex).

Age-standardized Cancer Mortality in BC Dashboard provides an overview of annual trends in age-standardized cancer mortality rates (ASMR, per 100,000 population) across British Columbia since 1995. It also displays the average annual percent change (AAPC) in these rates over time. This interactive dashboard allows users to customize their selections by cancer type, age group, sex, and year range. Results can be viewed in customizable data tables and downloaded for further analysis (Age-standardized Cancer Mortality Rates (ASMR) per 100,000 and Average Annual Percent Change (AAPC), British Columbia, by Cancer Type, Age at Death and Sex). 


Cancer Mortality (Deaths) in BC Health Regions Dashboard presents annual trends in the number cancer deaths across British Columbia’s five health authorities: Fraser Health (FH), Interior Health (IH), Northern Health (NH), Vancouver Coastal Health (VCH), and Vancouver Island Health (VIH), beginning in 1995. This interactive dashboard allows users to filter data by cancer type, age group, sex, and year range. Results can be viewed in customizable data tables and downloaded for further analysis (Cancer Mortality, British Columbia and Health Regions, by Cancer Type, Age at Death and Sex).


Standardized Cancer Mortality Ratio in Health Regions in BC Dashboard provides an overview of Standardized Mortality Ratios (SMR) and their 95% confidence intervals across British Columbia’s five health authorities — Fraser Health (FH), Interior Health (IH), Northern Health (NH), Vancouver Coastal Health (VCH), and Vancouver Island Health (VIH) — beginning in 1995. The SMR compares the observed number of cancer deaths in each region to the number expected based on provincial rates, allowing users to identify areas with higher or lower cancer mortality relative to the BC average (SMR = 1). This interactive dashboard enables users to explore data by health authority, cancer type, sex, and year range. Results can be viewed as data tables and are downloadable for further analysis (Standardized Mortality Ratio, British Columbia, by Health Region, Cancer Type and Sex). 

Create Your Own Pivot Table of Cancer Deaths in BC Dashboard allows users to create custom tables of cancer mortality in British Columbia since 1995. It provides a flexible, user-driven interface where you can select variables of interest including cancer type, cancer subtype, sex, age and year range, and then build a tabular output tailored to your needs. The output table is downloadable so you can export it for further analysis (Build your own pivot table for cancer mortality, British Columbia, by Cancer Type, Age at Death and Sex).

Cancer Mortality in Health Services Delivery Areas and Local Health Areas in BC Dashboard allows users to explore and compare cancer mortality across different geographic levels — including health authorities, health service delivery areas (HSDA), and local health areas (LHA). The dashboard presents both standardized mortality ratios (SMR) and age-standardized mortality rates (ASMR) to show differences in cancer burden across regions and over time. SMRs and ASMRs are calculated using 5-year rolling averages to improve stability and enable meaningful comparison across regions and years. An interactive heat map highlights areas with higher or lower cancer mortality, while trend charts display how rates have changed over time. Users can also view and download customizable data tables for further analysis (Standardized Mortality Ratio (SMR) by Local Health Area (LHA), British Columbia; Age-Standardized Mortality Rate (ASMR) per 100,000 by Local Health Area (LHA), British Columbia). 

Childhood Cancer Mortality in BC Dashboard presents crude and age-adjusted mortality rates and the number of childhood cancer deaths in British Columbia since 2000, summarized in 5-year periods. Users can explore results by cancer type, age group, sex, and year range, and create customizable tables that can be downloaded for further analysis. ​


Cancer Prevalence

Number of Prevalent Cancer Cases in BC Dashboard​ provides an overview of the number of people living with a previous cancer diagnosis across British Columbia, within the last 1, 5, 10, and 20 years. Users can explore data by cancer type, sex, and prevalence duration, and view results in interactive data tables that can be downloaded for further analysis. Prevalence reflects the number of individuals alive at a given time who have ever been diagnosed with cancer, providing insight into the ongoing burden of the disease and healthcare needs across BC (Number of Prevalent Cancer Cases for 1, 5, 10 and 20-year Limited Duration, British Columbia, by Cancer Type and Sex, 2024 Index Year). 

Number of Prevalent Cancer Cases in Health Regions in BC Dashboard presents an overview of the number of people living with a previous cancer diagnosis across British Columbia’s five health authorities: Fraser Health (FH), Interior Health (IH), Northern Health (NH), Vancouver Coastal Health (VCH), and Vancouver Island Health (VIH), within the last 1, 5, 10, and 20 years. Users can explore data by health authority, cancer type, sex, and prevalence duration, and view results in interactive data tables that can be downloaded for further analysis. Prevalence reflects the number of individuals alive at a given time who have ever been diagnosed with cancer, providing insight into the ongoing burden of the disease and healthcare needs across BC (Regional Number of Prevalent Cancer Cases, 2024 Index Year). 

Cancer Prevalence Over Time in BC Health Regions Dashboard presents annual trends in the number of people living with a previous cancer diagnosis across British Columbia’s five health authorities: Fraser Health (FH), Interior Health (IH), Northern Health (NH), Vancouver Coastal Health (VCH), and Vancouver Island Health (VIH), beginning in 1996. This interactive dashboard allows users to filter data by health authority, cancer type, sex, year range and prevalence duration. Results can be viewed in customizable data tables and downloaded for further analysis. Prevalence reflects the number of individuals alive at a given time who have ever been diagnosed with cancer, providing insight into the ongoing burden of the disease and healthcare needs across BC (BC/Regional Number of Prevalent Cancer Cases Over Time). 


Cancer Prevalence in BC Health Service Delivery Areas and Local Health Areas Dashboard​ allows users to explore and compare cancer prevalence across multiple geographic levels — including health authorities, health service delivery areas (HSDA), and local health areas (LHA). The dashboard presents crude prevalence proportions per 100,000 population, highlighting differences in cancer burden across regions and over time. An interactive heat map visualizes areas with higher or lower prevalence, while trend charts show how these patterns have changed over time. Users can also view and download customizable data tables for further analysis. Prevalence represents the number of individuals alive at a given time who have ever been diagnosed with cancer, offering insight into the ongoing disease burden and healthcare needs across BC. (Crude Five-Year Prevalence Proportion (CPP) per 100,000 by Local Health Area (LHA), British Columbia). 


Childhood Cancer Prevalence in BC Dashboard provides an overview of annual trends in crude and age-adjusted prevalence proportions, as well as the number of prevalent childhood cancer cases in British Columbia since 2005. Results can be stratified by cancer type, age group, sex, and year range, and the dashboard includes customizable data tables with downloadable outputs for further analysis.​


​​​​​​​​​​​​​​​​​​​​​​​​​​​​​​​​​​​​​​​

Cancer Projections

Projected Cancer Incidence in BC Health Regions Dashboard provides estimates of future cancer incidence trends up to 2038 across British Columbia and its five health authorities — Fraser Health (FH), Interior Health (IH), Northern Health (NH), Vancouver Coastal Health (VCH), and Vancouver Island Health (VIH) — based on patterns observed between 2013 and 2023 (excluding 2020 due to the COVID-19 impact). This interactive dashboard allows users to explore projected cancer incidence by cancer type, sex, region, age, and year, view interactive charts, and download tabular outputs for further analysis (Projected Cancer Incidence, British Columbia and Health Regions, by Cancer Type, Age at Diagnosis and Sex). 


Projected Cancer Diagnoses in BC Small Health Areas Dashboard provides estimates of future cancer incidence trends up to 2038 across British Columbia at a more granular geographic level, including Health Service Delivery Areas (HSDA) and Local Health Areas (LHA). Projections are based on patterns observed between 2013 and 2023 (excluding 2020 due to the impact of COVID-19). This interactive dashboard allows users to explore projected cancer incidence by region and year, view interactive charts, and download tabular outputs for further analysis (Projected All Cancer Incidence by Administrative Health Boundaries in British Columbia). 


​Cancer Outcomes (Lifetime Risk, Survival)​

Lifetime Cancer Risk of Being Diagnosed Dashboard presents estimates of the probability that an individual will be diagnosed with cancer over their lifetime across British Columbia cancer (e.g. 1 in X people will develop breast cancer). This interactive dashboard allows users to select cancer type and year of diagnosis to explore lifetime risk estimates from 1995 onward. Results can be viewed through interactive visualizations and data tables, enabling comparisons across cancer types and over time, and can be exported for further analysis (Lifetime Risk of Being Diagnosed With Cancer by Cancer Type, Year and Sex). 
 
​Lifetime Cancer Risk of Dying Dashboard presents estimates of the probability that an individual will die from cancer over their lifetime across British Columbia cancer (e.g. 1 in X people will die from breast cancer). This interactive dashboard allows users to select cancer type and year of death to explore lifetime risk estimates from 1995 onward. Results can be viewed through interactive visualizations and data tables, enabling comparisons across cancer types and over time, and can be exported for further analysis (Lifetime Risk of Dying from Cancer by Cancer Type, Year and Sex).


Survival Rate Dashboard provides an overview of age-standardized relative cancer survival rates and their changes over time across British Columbia from 1998 to 2023. Users can explore both observed survival and age-standardized relative survival by cancer type and survival time. The interactive interface features arrow charts, trend graphs, and data tables, all of which can be exported for further analysis (Age-standardized Relative Survival Rates, Age 15-99, British Columbia).


Survival Rate by Stage Das​hboard​ provides an overview of age-standardized relative cancer survival rates by stage in British Columbia. Users can explore results by survival time, cancer type, and stage, using interactive bar plots and data tables that can be exported for further analysis.

​Service Utilization​

BC Radiation Therapy Utilization Dashboard provides an overview of radiation therapy use and patterns across cancer types in British Columbia, offering insights into treatment distribution and temporal trends since 1985. Users can filter by cancer type, cancer subtype, sex, age, and year to explore patterns in radiation therapy utilization. The interactive dashboard features bar plots and downloadable data tables, supporting deeper analysis of how radiotherapy services are delivered across BC. 

​​​​​​​​​​​​​


​​Our Data Sources​​

​​​​​

​​Our Data Sources

Our main data sources are:
the BC Cancer Registry
the BC Cancer Information System (CAIS)
BC Vital Statistics Agency
BC Stats
Statistics Canada​